The Five Layers That Make Your Data Stack AI-Ready
Every "AI for data" demo I've seen does the same magic trick: point a model at a database, ask a question in English, get an answer. It's genuinely impressive for about a hundred tables. Then it quietly falls apart — the model joins two unrelated id columns, invents a metric, or confidently reports a number that contradicts the dashboard three feet away. The usual reaction is "the model isn't smart enough yet." I've come to think that's almost always the wrong diagnosis.
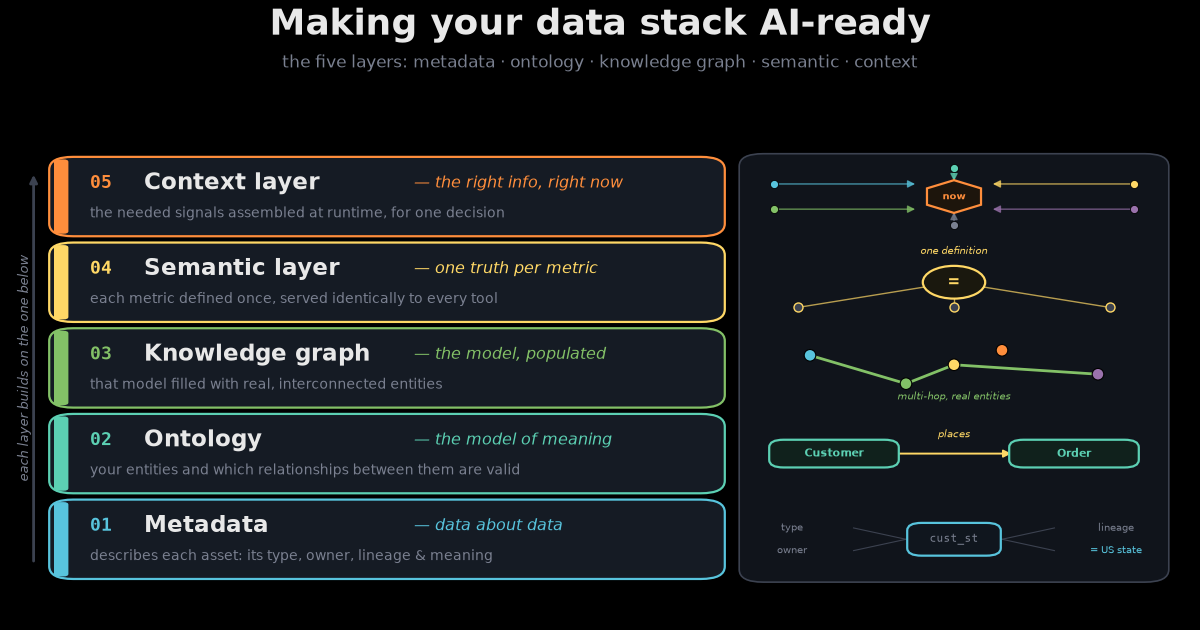
I recently read Sanjeev Mohan's FAQ on metadata, semantics, taxonomy, ontology, knowledge graphs, and context, and it gave me the vocabulary for something I'd half-noticed building these systems. These terms aren't competing buzzwords you pick one of. They're a stack — five layers that, together, are what it actually means for a data stack to be "AI-ready." Each one solves a failure mode the layer above it can't even see. Skip one and the system doesn't fail loudly; it fails predictably, in a way that looks like a model problem but isn't.
This post is my attempt to draw that stack — the work between a pile of tables and an agent you can trust. One running example threads through all five: a customer named Jane who bought a MacBook Air, and a support agent trying to help her. Each layer is what stands between that agent and a hallucination.
1. Metadata — making a cryptic asset usable
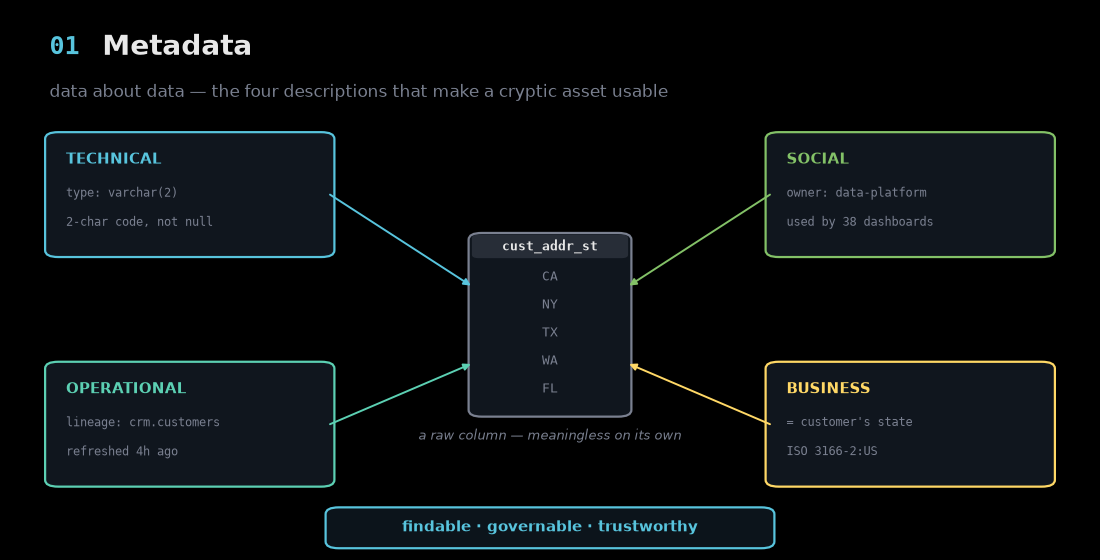
Start at the bottom, with the least glamorous layer. You have a column called cust_addr_st holding values like CA, NY, TX. On its own it's noise — is that a status? A store code? A state?
Metadata is the data about that data, and it comes in four flavors: technical (it's a 2-char varchar, not null), operational (it came from crm.customers, refreshed four hours ago), social (the data-platform team owns it, 38 dashboards use it), and business (it's the customer's state, encoded as ISO 3166-2:US). None of that is the data itself. All of it is what makes the data findable, governable, and trustworthy.
This is the foundation precisely because everything above depends on it. Without metadata, nothing is findable — and an agent can't reason about a column it can't even locate or interpret.
2. Ontology — the rules of meaning
Now that assets are described, you need a shared model of what the concepts mean and how they may legally connect. This is where people conflate two different things, so the contrast is worth drawing carefully.
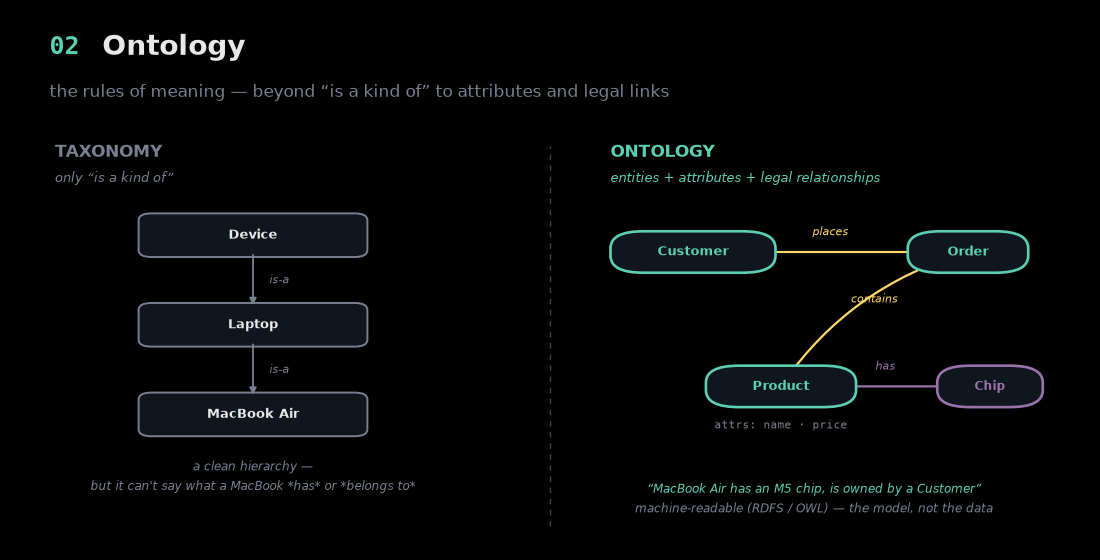
A taxonomy is a hierarchy — "a MacBook Air is a kind of laptop, which is a kind of device." Clean and useful, but it can only express is-a. It can't say what a MacBook has or who it belongs to.
An ontology goes further: it encodes entities, their attributes, and the relationships that are allowed between them. A Customer places an Order; an Order contains Products; a Product has a chip. It's written in machine-readable languages like RDFS and OWL, and crucially it's the model, not the data — the rulebook for what counts as a valid fact. Industry standards like Schema.org and FIBO give whole domains a shared vocabulary so everyone's "Order" means the same thing. Without an ontology, every team defines the core concepts differently, and the agent inherits the chaos.
3. Knowledge graph — the facts
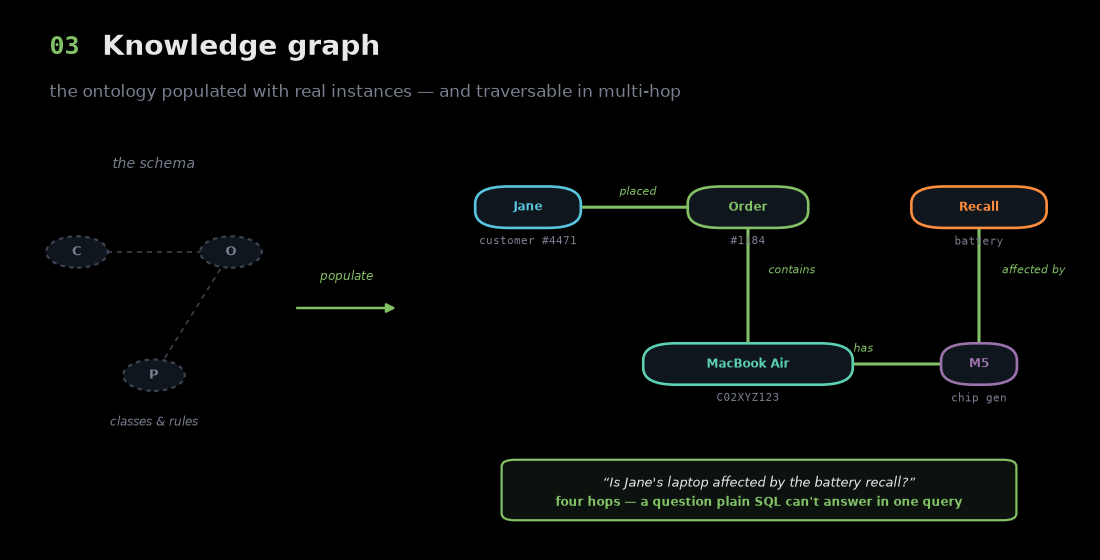
An ontology is an empty template. Populate it with actual instances — Jane (customer #4471), her Order #1184, the specific MacBook Air with serial C02XYZ123, its M5 chip — and you get a knowledge graph: nodes for real entities, edges for the real relationships between them.
The payoff is the kind of question this makes answerable. "Is Jane's laptop affected by the battery recall?" is a four-hop traversal — Jane → her order → that MacBook → its chip generation → an open recall. That's a question plain SQL can't answer in a single query, but it's a natural walk across a graph. This is also what makes GraphRAG work: the agent retrieves a connected web of entities, not a pile of isolated documents. The ontology gave us the rules; the knowledge graph gives us the facts that obey them.
4. Semantic layer — the governed contract
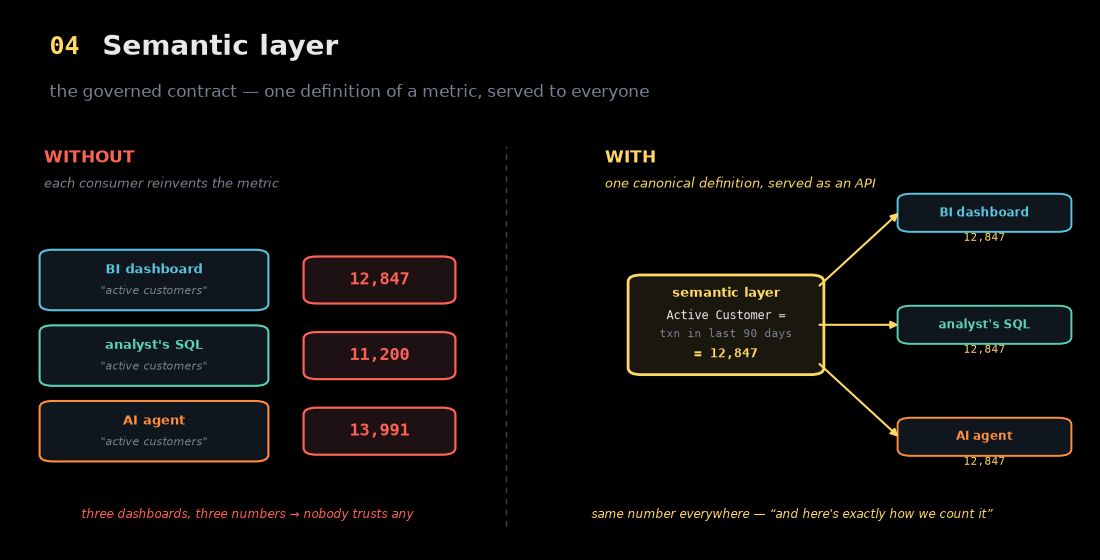
Here's a failure I've watched happen in real organizations. Three people ask "how many active customers do we have?" The BI dashboard says 12,847, an analyst's hand-written SQL says 11,200, and the AI agent says 13,991 — because each one quietly invented its own definition of "active." Now nobody trusts any of the numbers.
The semantic layer is the fix: a single, governed place where "Active Customer = a transaction in the last 90 days" lives once and is served to every consumer as an API — dashboards, analysts, and AI agents all reading the same definition. Ask for active customers and you get 12,847, and here's exactly how we count them. It's where metrics, KPIs, business rules, and hierarchies become a contract instead of a folklore. Without it, every dashboard conflicts — and an agent confidently quoting one of three contradictory numbers is worse than no agent at all.
5. Context layer — the moment
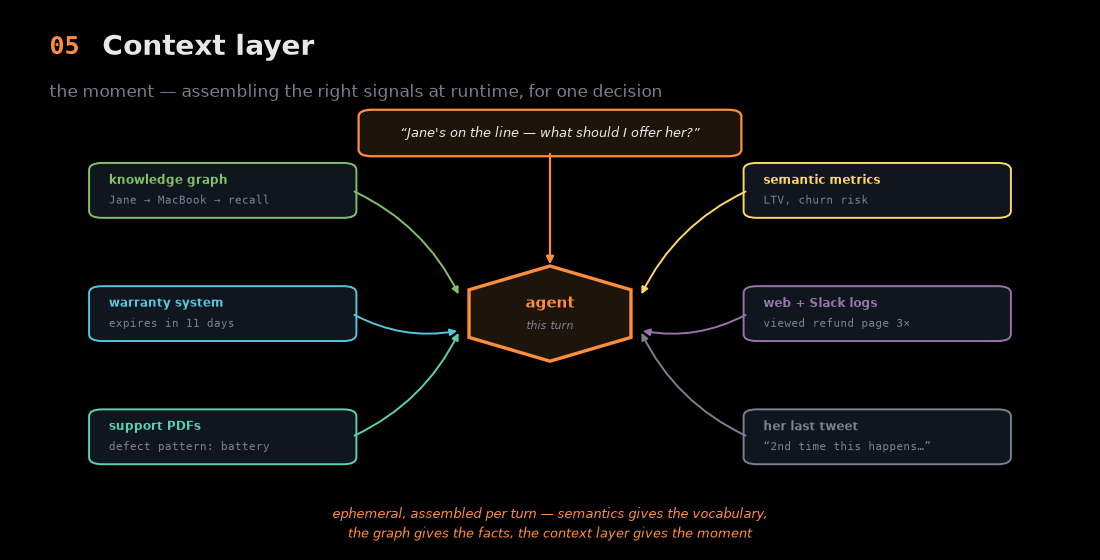
The top layer is the one I find most interesting, and the one that's newest. Everything below is, in a sense, stored. The context layer is a runtime act: when Jane calls and the agent has to decide what to offer her, something has to pull together — right then — her purchase history from the knowledge graph, her warranty status (expires in 11 days), the support PDF describing the battery defect pattern, her lifetime-value metric from the semantic layer, the fact that she viewed the refund page three times this morning, and the slightly furious tweet she just posted.
That assembly is ephemeral, stitched together per turn from systems of record, live streams, and unstructured junk like emails and Slack. Sanjeev frames the building pattern as Extract, Context, Link (ECL) — connect every source, infer what its entities mean, and stitch them into one graph. The line that stuck with me: if semantics gives you the vocabulary and the knowledge graph gives you the facts, the context layer gives you the moment. It's the difference between an agent that has the data and one that has judgment.
Why it's a stack, not a menu
The reason to draw these as layers rather than a list is that the dependencies only run one way, and the failures compound:
- Without metadata, nothing is findable.
- Without an ontology, everyone defines concepts differently.
- Without a knowledge graph, you can answer "what was sold" but not "what is connected."
- Without a semantic layer, every dashboard conflicts.
- Without a context layer, the agent has the data but not the judgment.
And the most important consequence is at the top. A context layer is the shiniest thing to build, but bolting one onto ungoverned metadata and inconsistent semantics doesn't give you a smart agent — it gives you, in Sanjeev's words, "a faster way to be wrong." The same lesson I took from how Eon makes a million-table data lake answerable and from monday.com's blueprint for AI over data: the model is rarely the bottleneck. Making your data stack AI-ready is the unglamorous work underneath it. Standards like the Open Semantic Interchange and the Model Context Protocol exist precisely so you can build that stack once and have it travel — but you still have to build it, bottom to top.
The figures above are a visual restatement of Sanjeev Mohan's FAQ; the Jane / MacBook example and the illustrative numbers are mine, picked for clarity, not output from a live system. The matplotlib generators for every figure live in research/metadata-stack/.