Semantic Context That Builds Itself
Your data has a history. Your agent needs to know it.
Over the past few months I've been helping several data-heavy organizations build the context layer that lets AI agents actually work with their data. The problem sounds simple. Give the agent access to the database. Give it the schema. Explain the organization's terminology. Now it should be able to answer questions.
And it does work, if you do it right. The catch is what "right" takes. Every analyst team has to build its part carefully, not everyone knows how, and the moment you finish, it starts going stale. Because data has a history, and that history usually isn't in the data.
The things your analysts just know
Imagine asking an experienced analyst to calculate a business metric. They don't simply look at the schema, find a promising table and write a query. They know which tables to query in the first place, and which ones to trust. And then they know things like:
- There was an ingestion failure for three days in March, so that period needs special handling.
customer_idin one system is lowercase, while another system preserves case.- A particular data source was reliable until June 2025, but after that date another source should be used.
- There are three tables that appear to contain the same information, but only one is used for financial reporting.
- A certain field sounds like the right field for a metric, but isn't.
- Two tables can technically be joined on a particular column, but shouldn't be.
- A historical migration means that records before a certain date need to be interpreted differently.
None of this appears in the schema. In many cases you cannot discover it by looking harder at the data either. It lives in the heads of the analysts who have spent years working with it.
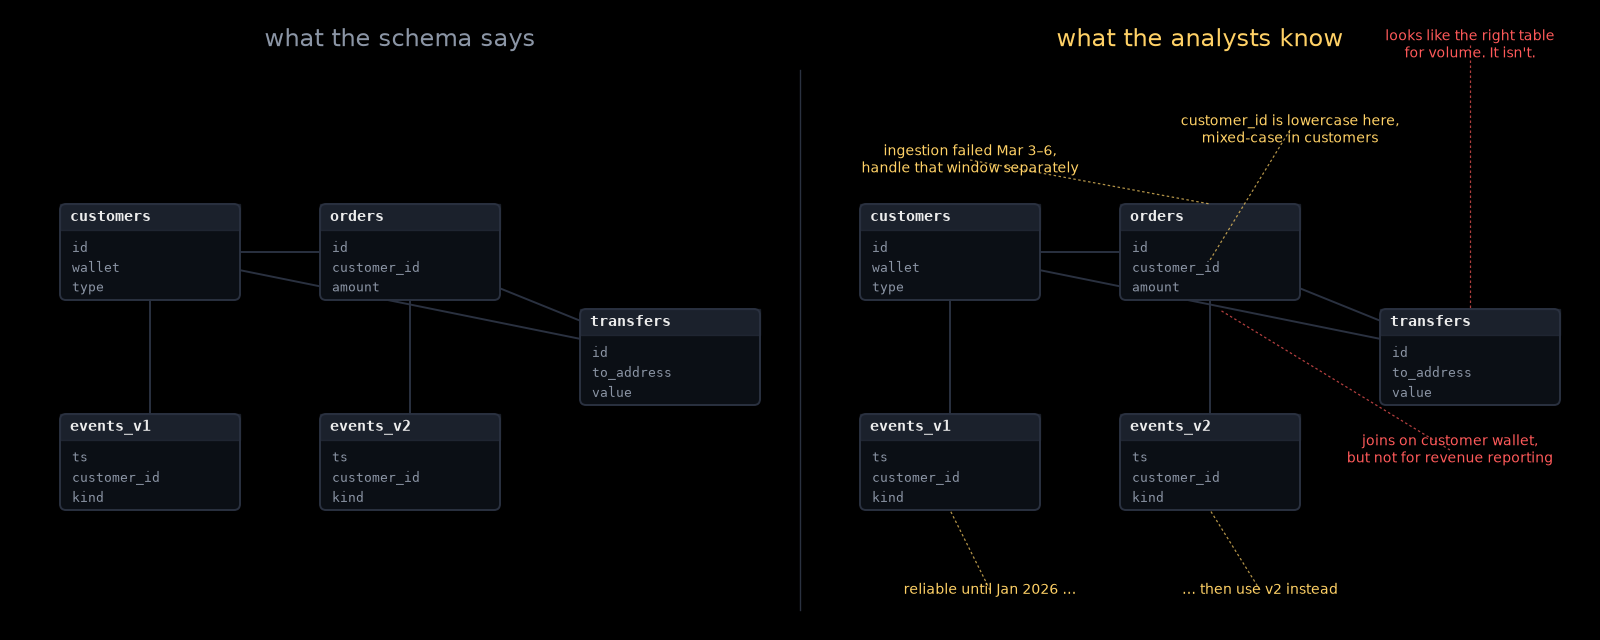
That becomes a fundamental problem when we want AI agents to work with organizational data. Giving an agent access to your data is relatively easy. Giving it the accumulated context of the people who understand that data is much harder.
The easy answer: write it all down
One solution is curation. You create a comprehensive skill or knowledge base explaining the organization's data. Here are our business concepts. Here are the relevant tables. Here is how they relate. Here is how you calculate each metric. Here are the joins you should use. Here are the caveats. Here are the weird historical exceptions.
Done properly, this is probably the highest-quality source of context you can give an agent. There is only one problem: it is incredibly expensive. Not computationally expensive. Organizationally expensive.
Someone has to extract all this knowledge from analysts. Someone has to structure it. Someone has to decide what matters. And, most importantly, someone has to keep it current. A new table appears. A pipeline changes. Someone discovers that a field is unreliable. A definition changes. An analyst finds a better way of calculating something. Your beautifully curated context is already going stale.
So the question I've been working on is slightly different: how much of the context layer can we build automatically, so that humans only have to curate the things that cannot be learned any other way?
I think the answer is surprisingly large.
A three-layer context model
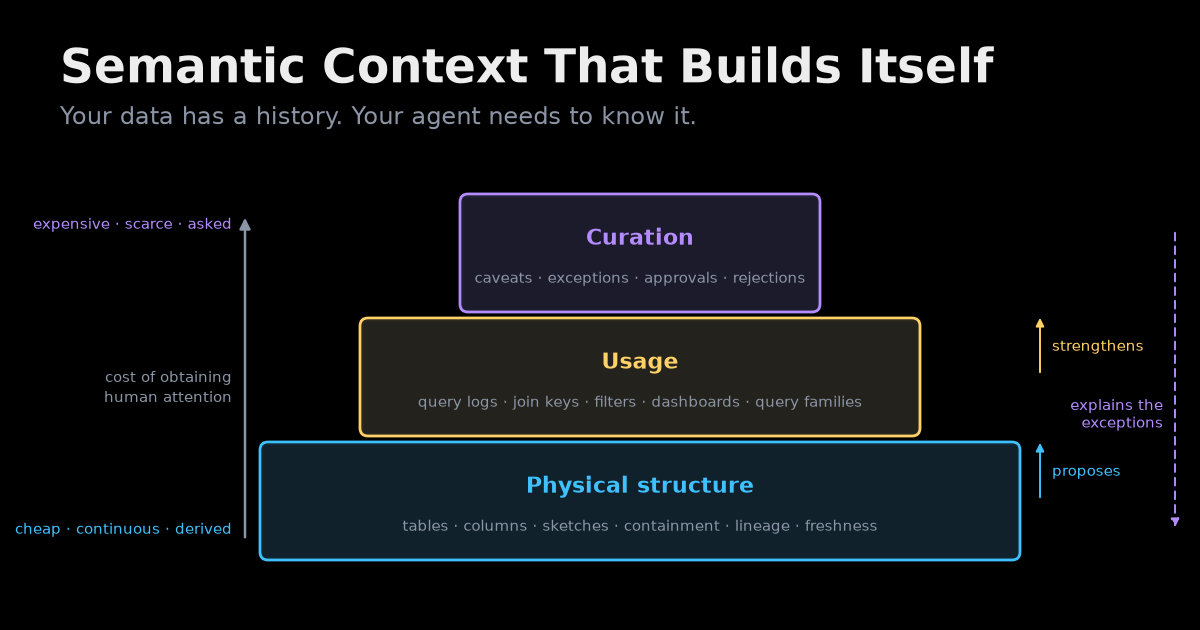
The approach I've been using has three sources of context, and I picture them as a pedestal:
Physical structure → Usage → Curation
Each layer tells us something the previous layer cannot. And the cost of obtaining the information increases as you move up. So we should extract as much as possible from the bottom before asking humans to provide the rest.
(If you've read my post on the five layers that make a data stack AI-ready, this is about how the context layer at the top of that stack gets built, rather than what it is.)
Layer 1: Physical structure
Start with what you can learn directly from the data platform. Tables, columns, types, cardinality, value distributions, partitions, freshness, foreign keys where they exist, lineage. Whatever metadata and comments people bothered to leave in the catalog.
More than you'd expect can be inferred from that alone. Sample a column and you
can usually tell what it is: an identifier, a timestamp, an amount, a country
code, an email. Look at which columns are unique and which repeat, and you get the
table's grain: one row per order, per customer per day, per event. Combine the
name, the columns and a few sampled rows and you can draft a description of the
table that's often better than the one nobody wrote. It also catches a pattern
that trips up every naive schema dump: rolling tables. events_2026_01,
events_2026_02, events_2026_03 are one logical table with a monthly partition,
not thirty separate tables, and grouping them is a matter of noticing the shared
structure and the naming pattern.
The most valuable inference, though, is relationships that were never declared.
Suppose we have a users table and an addresses table. There may be no
foreign-key constraint between them. But if addresses.user_id has the same type
as users.id, and almost every value in addresses.user_id appears in
users.id, that's a strong signal that these datasets are related.
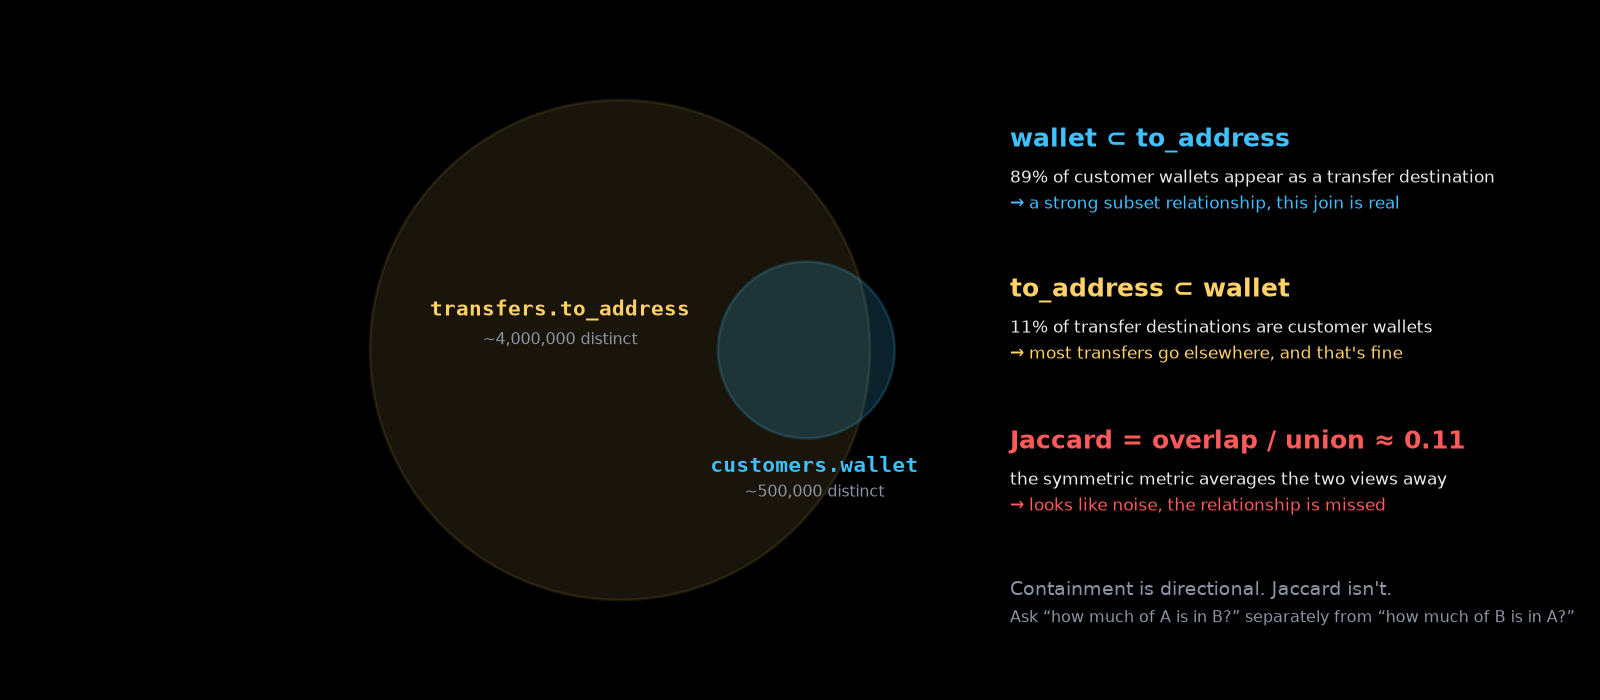
The detail that matters here is that the relationship is directional. The
metric people reach for first is Jaccard similarity, the overlap of two columns
divided by their union, and it misses most of the interesting cases. A concrete
example from a system I worked on: a customers table with about half a million
wallet addresses, and a transfers table with four million destination addresses.
Around 89% of the customer wallets show up as transfer destinations. Only about
11% of the destinations are customer wallets. The Jaccard similarity is a
miserable 0.11, which looks like noise. But "nearly every customer wallet appears
in transfers" is exactly the subset relationship you want to know about.
Two practical notes on doing this at scale. First, you don't ship the columns anywhere. You compute a small bottom-k hash sketch of each column inside the warehouse, and only the sketches cross the wire, which is enough to estimate containment in both directions. Second, five sampled rows are never evidence. When the sketches suggest a candidate, the collector probes it with a growing sample and keeps doubling until the confidence interval is tight enough to say keep, reject, or, honestly, insufficient. That last verdict is one most profilers don't have, and it's the one that keeps garbage out of the graph.
Do this across thousands of tables and you can start constructing a physical map of the organization's data. It doesn't tell you what everything means. But it gives you the skeleton, and it's cheap to build and cheap to keep updated because most of it can be continuously derived from the data itself.
Layer 2: Usage
The physical structure tells us what could be done with the data. Usage tells us what the organization actually does with it. I think this is still the most underused source of semantic information in most companies.
Look at the query logs. Which tables are queried together? Which columns are commonly used as join keys? Which filters appear repeatedly? Which tables feed important dashboards? Which queries run every morning? Which datasets are used by finance, operations or product? Which reports reach senior management?
If two tables could be joined five different ways, but thousands of successful queries consistently join them one particular way, that's valuable information. A dashboard is even stronger context. A report sent to the CEO probably wasn't assembled by randomly selecting tables. Somewhere behind it is a chain of queries, transformations and decisions made by people who understand the organization.
Those decisions leave traces. Query history, dashboards, notebooks, reports, ETL pipelines and lineage collectively form something like the behavioral record of the organization's data knowledge. (The version I've built so far reads query history, view definitions, dbt manifests and OpenLineage events; dashboards and notebooks are next.) Instead of asking analysts to document all of that knowledge again, we can learn a large part of it from what they already do.
A few things I found useful in practice:
- Normalize queries into families. Replace literals with typed slots, canonicalize aliases, and fingerprint the result. Thousands of near-duplicate queries collapse into a few hundred templates, each with a count, a success rate and the join it exercises. The templates with a high success rate that use an approved join are the exemplars, and they're the best few-shot examples an agent can get for "how do people here actually query this."
- Mine lineage from the logs. Every successful
CREATE TABLE AS,INSERT INTO ... SELECTand view definition is a lineage edge you get for free. If two downstream columns share an upstream ancestor, that's a join candidate. - Learn freshness instead of declaring it. Watch when each table's latest data advances across builds, take the median interval, and you know its cadence. A table that's late by three cadences is stale; a table with too few observations is unknown, not cold.
There's also a trap in this layer, and it's worth naming. Frequent use makes a relation useful. It does not make it correct. Usage is great at ranking among tables that are already relevant, and terrible at introducing new ones or proving a join. Popularity should never rescue a weak match.
Layer 3: Curation
Only then do we get to explicit human knowledge. This is where we capture what neither physical inspection nor usage can tell us.
"The source before July is unreliable." "Don't use this table for revenue reporting." "This customer type is called an account internally." "Exclude these transactions when calculating this metric." "This field changed meaning after the migration."
In practice, curation is the layer that can override everything below it: a table or column description, the grain of a table, a comment on a join ("valid, but normalize case first"), a recipe for a metric, a gold question with the query that answers it, a semantic-layer definition, a deprecation date. The lower layers propose all of these. Curation gets the final word on any of them.
This is the expensive context. So we should treat human attention as the scarce resource and reserve it for information that actually requires human knowledge. Instead of asking analysts to document the entire data estate, we're asking them to fill the gaps.
And there's another important difference. Curation doesn't have to happen as a documentation project. It can happen while people work.
Evidence over verdicts
Before getting to how the layers feed each other, one design decision turned out to matter more than anything else, and it's about what the context actually stores.
A conventional catalog stores a verdict: "these two columns are related, confidence 0.87." The thing I've converged on stores evidence instead. Every join specification keeps its physical evidence (containment in both directions, distinct ratios, fanout risk), its usage evidence (how many queries joined this way, how many succeeded), and its curation status, side by side. There's still a score, because an agent has to rank candidates. But the score only ranks. It never replaces the evidence. Don't tell an agent "these tables join." Show it the containment, the observed usage, the fanout risk, and who, if anyone, approved it.
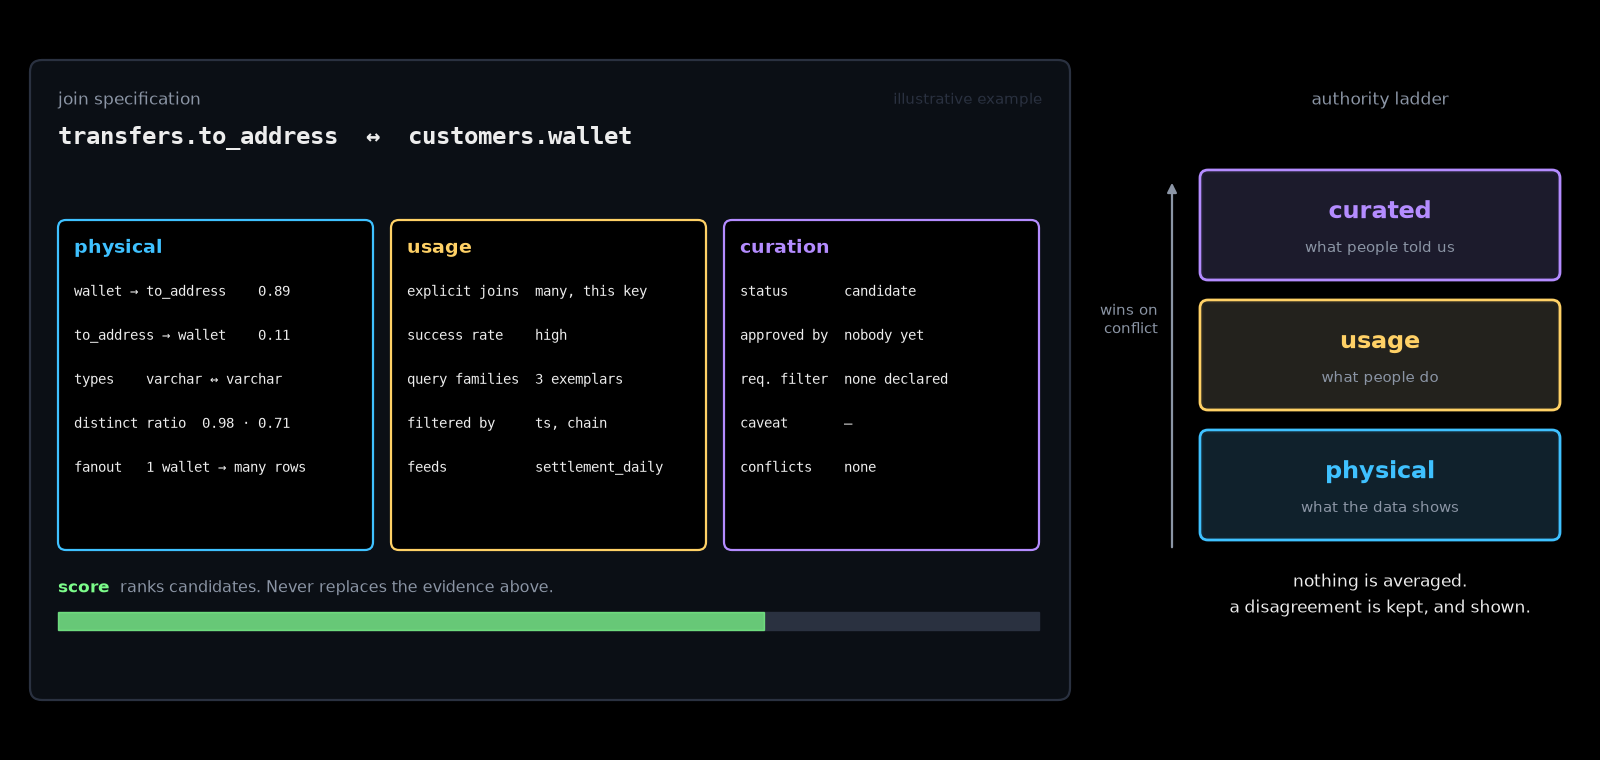
The three layers then become an authority ladder: curated beats usage beats physical. When the layers disagree, nothing gets averaged. The disagreement becomes a first-class object the agent can see: here's what the data suggests, here's what people do, here's what the analyst said, and they don't agree. That's more useful than a blended number that hides the fight.
A few rules fall out of this that I'd now consider non-negotiable:
- Rejected is a gate, not a low score. If an analyst rejected a join, it doesn't show up ranked last. It doesn't show up.
- Retrievable is not executable. Embedding similarity and "these tables are often queried together" are great for finding things. They can nominate a join for a physical probe. They can never produce one by themselves. Most vector-catalog products blur this line, and it's exactly the line that separates a helpful suggestion from a confidently wrong query.
- Generated joins are always candidates. The builder never approves anything. Only a human moves a join from candidate to approved, deprecated, or rejected.
Context should learn from mistakes
Now the part I find most interesting. Imagine an agent attempts a join. It expects two columns to match, but almost nothing joins. It investigates and discovers that one column contains lowercase identifiers while the other contains mixed-case identifiers.
Traditionally, the agent fixes the query and moves on. That's wasteful. It just discovered something about the organization's data. That discovery should become context:
When joining
A.customer_idwithB.customer_id, normalize case first.
The next analyst shouldn't have to rediscover it. And neither should the next agent.
The same mechanism works with human feedback. An analyst corrects an agent: "Don't
use events_v1 after January 2026. Use events_v2." That's not merely feedback
for the current conversation. It's organizational knowledge. Capture it once and
every subsequent agent, and potentially every human analyst, benefits from it.
Mechanically, this is a session lifecycle. The agent asks the context layer for a
working set, runs (or decides not to run) its query, and then debriefs: what it
actually used, whether the recommendation was used, modified or rejected, and,
crucially, what the graph was missing. Misses are evidence, not errors. A
rejected recommendation with a reusable reason ("not for revenue reporting, use
finance.revenue_daily instead") becomes a proposed piece of negative knowledge,
scoped to the scenario it applies to.
Here's the subtle bit, and the one I got wrong first: the learning is deliberately asymmetric.
- Positive signals are small, capped, and visible. A validated answer or a thumbs-up nudges a join's score up by a few hundredths, and the nudge is shown as its own component rather than folded into the base.
- Negative signals never lower a score, and never auto-reject. They open a review item for a human, with the exact curation snippet ready to paste.
- A query that ran successfully is not accepted as proof that the join was correct. A successful but semantically wrong query would otherwise strengthen the graph, and an agent that's confidently wrong once should not make the next agent more confidently wrong.
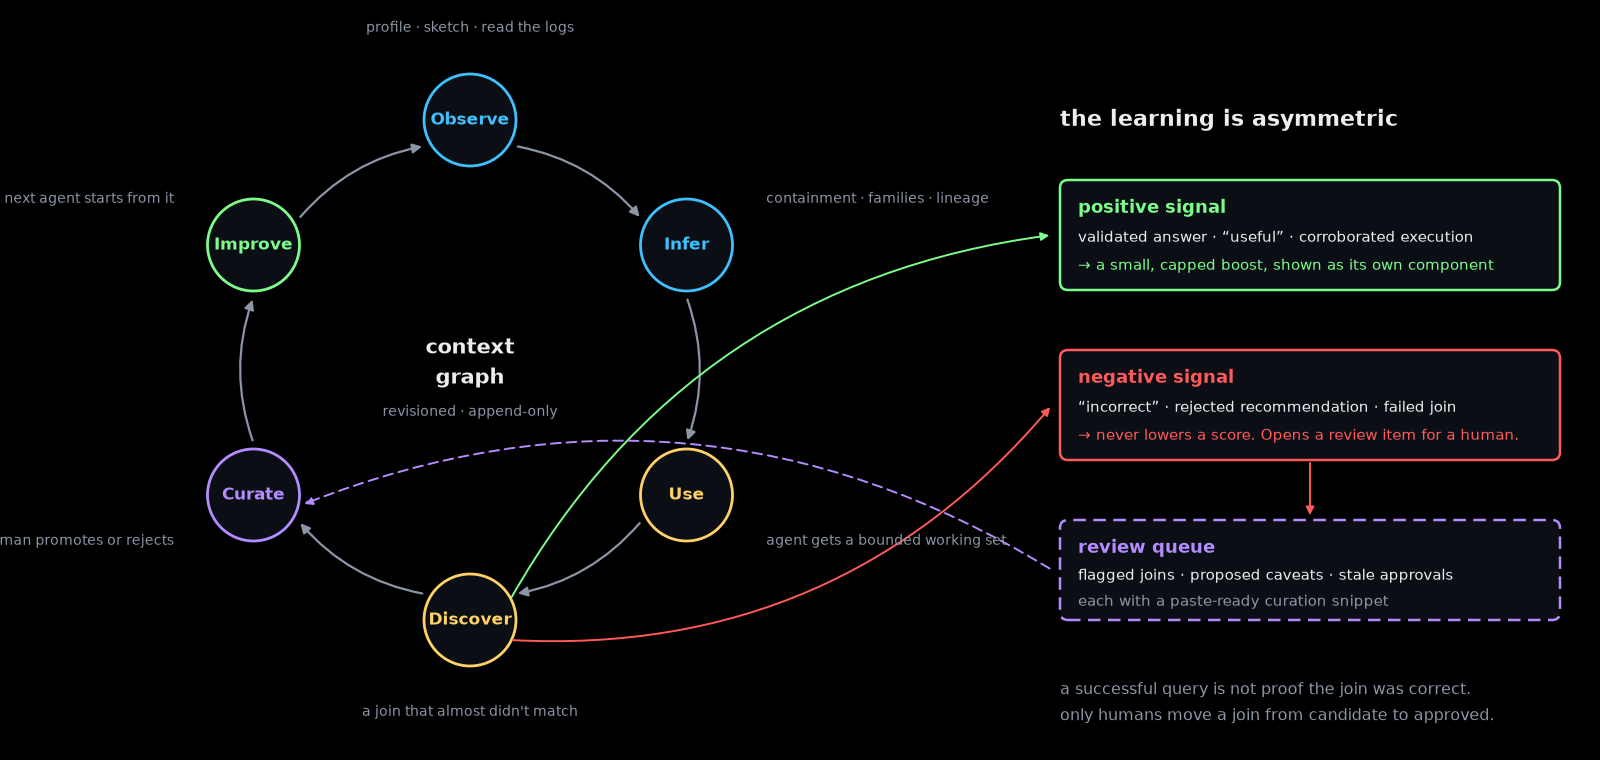
The result is a feedback loop where agents and analysts propose, and only humans promote. Human attention is still the bottleneck, but it's spent on a short queue of things the lower layers flagged, not on documenting the world.
What this looks like in practice
The concrete system I've been building is a context graph: tables, columns, join specifications, lineage edges, query families and assertions, each carrying its source (physical, usage, or curated) and a time range for when it was true and when it was learned. Every build produces an immutable, versioned bundle plus a human review file. Agents talk to it through an MCP server.
Two things about the agent side are worth mentioning, because they're where "context" meets "context window."
Gradual discovery. An agent never gets the whole warehouse. It asks a question and receives a bounded working set: a dozen candidate tables, the joins between them with their evidence, the filters people usually apply, warnings, and a small subgraph. If that answers the task, it stops. If not, it drills down with four small primitives, search a node, inspect it, get its neighbors, find a path, and each hop is bounded and paginated. Before writing multi-table SQL it asks for a join path explicitly, and that's where the gates apply. The failure mode this prevents is the obvious one: dumping thousands of columns into a prompt and hoping the model picks right.
The builder is gradual too. The graph is built by an agent running a skill, phase by phase: profile, sketch, mine usage, extract lineage, build, and an optional enrichment phase where the agent drafts descriptions from the evidence. The skill loads its own reference material only at the phase that needs it, and the collector scripts run outside the model's context entirely. Enrichment is the one place the model writes, and its output lands at the bottom of the authority ladder, flagged as unreviewed, searchable but never authoritative.
(The animation is a schematic of the process on a handful of made-up tables, not a recording of the real system.)
The benchmark that doesn't exist
I evaluated all of this the way everyone does, on text-to-SQL benchmarks, and the experience convinced me that the benchmark we actually need doesn't exist yet.
Public text-to-SQL benchmarks give you a schema and a question. Sometimes a lot of schema. What they never give you is the organization around it: no query history, no lineage, no dashboards, no "we switched sources in June," no analyst who rejected a join last quarter. Which means that on those benchmarks a context layer can only show its cheapest layer, the physical one, and the interesting two thirds of it are invisible. Retrieval on a bare schema is a real problem, and missing a single needed table reliably turns into a wrong query downstream. But it's not the problem organizations actually have.
The benchmark I'd like to see is an organizational-context benchmark: a warehouse with its history. Months of real query logs, lineage from the pipelines that populate it, dashboards with their consumers, a handful of curated caveats, a few deliberately planted traps (the deprecated twin table that still gets queried, the column that changed meaning after a migration), and questions whose correct answers depend on knowing that history. Score not just whether the SQL runs, but whether the agent used the right source for the period, applied the required filter, and avoided the join a human rejected.
Nobody has published one, largely because the data is exactly the kind companies can't share. I think it's buildable synthetically, the way I built my own seeded-warehouse test suite: generate the history along with the data, and let the generator be the ground truth. If someone wants to work on that, I'd be very interested.
The context layer should breathe
This is ultimately the architecture I find most compelling.
At the bottom is the physical reality of the data platform, continuously discovered. Above it is the organization's usage of that data, continuously observed. And above that is explicit knowledge, contributed by humans and agents when they encounter something the lower layers cannot explain.
The layers reinforce each other. Physical analysis proposes relationships. Usage strengthens or weakens them. Human knowledge explains the exceptions. Agent interactions discover new exceptions. And those discoveries become context for future interactions.
The result isn't a semantic layer someone has to finish building before agents can be useful. It's a semantic context layer that builds itself over time.
The goal isn't to eliminate curation. There will always be knowledge that exists only in people's heads. The goal is to minimize the amount of knowledge humans have to curate manually. Derive what you can from the data. Learn what you can from how the organization already uses it. Ask humans for what remains. And make every new discovery part of the context available to everyone else.
That's how I've been approaching the problem: not as a documentation exercise, but as a continuously learning layer between an organization's data and the humans and agents trying to understand it.
Because the hardest part of querying organizational data was never knowing where the tables are. It's knowing their history.